

Finding an options strategy is only part of the work. The next question is whether the conditions that made that strategy worth researching are actually present today.
That question was at the center of our September 15 webinar with Ophir Gottlieb and Jason Hitchings. We explored how entry conditions affect historical results, why some days have no qualifying setups, and how Today Tab 2.0 brings that research into one place.
With six prebuilt strategies, intraday scans, historical results, and option details, Today 2.0 gives TradeMachine® members a simpler starting point for evaluating options strategies within their own trading plans.
Watch the Today 2.0 walkthrough
See how the page connects a setup’s status, its historical results, and the option contracts selected by the strategy.
Why waiting belongs in the process
A strategy is more than its option structure. Its entry conditions, closing rules, and execution assumptions all help define what is being tested.
Consider a call diagonal that opens only after a stock crosses above its 200-day moving average and gains at least 3% that day. Opening the same option structure before those conditions occur changes the strategy. The original backtest no longer describes that entry decision.
The webinar made this distinction concrete. In the roughly three-year historical analysis presented, Ophir summarized the six-strategy comparison using these rounded figures:
| Historical backtest comparison | Win rate | Average return per trade |
|---|---|---|
| With the specified entry filters | About 70% | About 14% |
| With the entry filters removed | About 54% | About 2% |
The lesson is practical: the conditions are part of the strategy. Having the patience to wait for them preserves the connection between the setup being evaluated and its historical evidence.
One page connects the setup to the evidence
Today 2.0 scans for qualifying setups throughout the market day. It brings together the pieces that would otherwise require moving between screens:
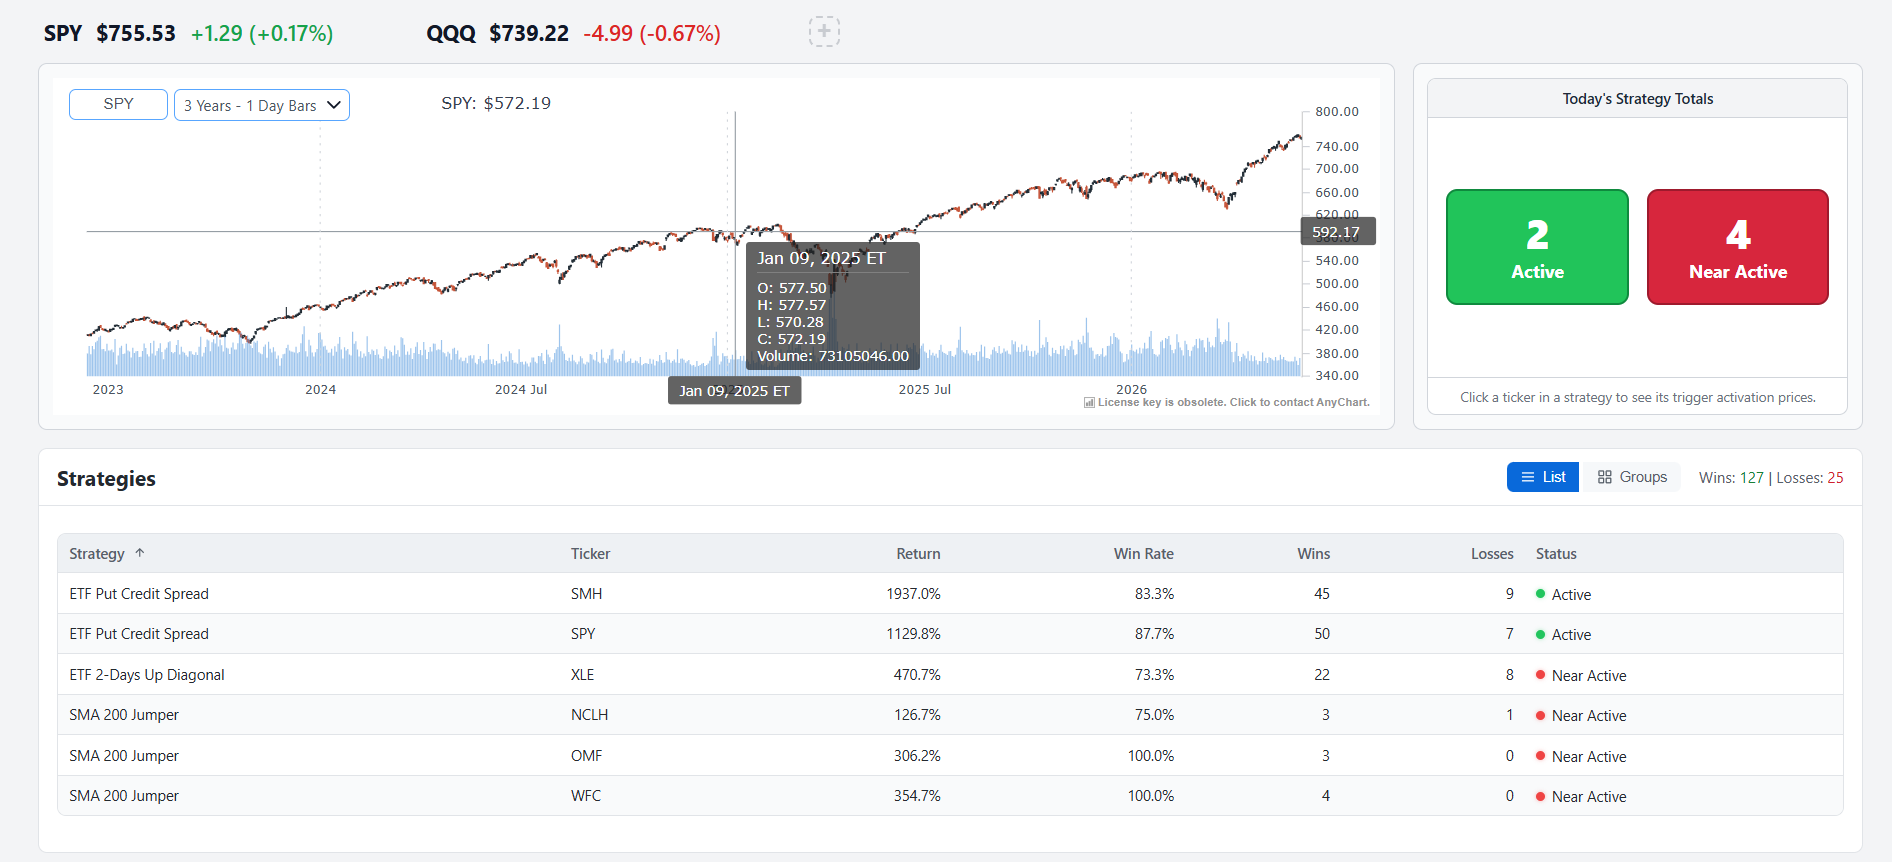
- Active and Near Active setups, organized by strategy or in a list.
- A stock chart showing historical backtest entries and exits.
- A price activation display showing how a move in the underlying could change the trigger status.
- Backtest results, including average return, win rate, and the number of wins and losses.
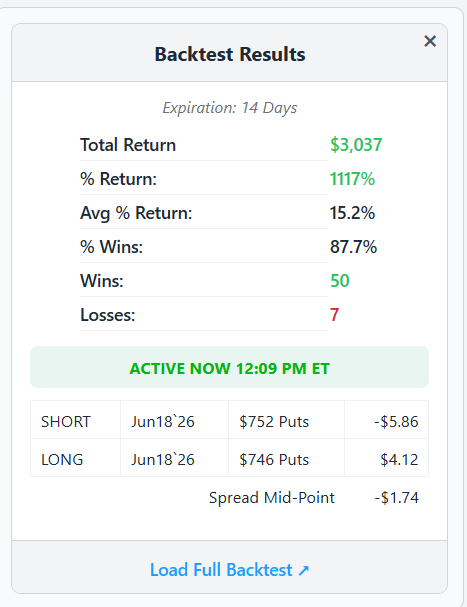
- Strategy Details and Show Options, connecting the rules to the option contracts selected by the model when a setup is active.
There is no need to build a portfolio of backtests or configure personal alerts to begin using this page. Select a ticker to investigate the setup. For deeper research, Load Full Backtest opens the settings and individual historical trades behind the summary.
A win rate needs context: the number of trades and the size of the wins and losses matter, too. Three historical trades provide much less evidence than a larger sample. TradeMachine® lets you inspect the underlying history and test changes to the assumptions yourself.
Six strategies for different market conditions
Today 2.0 brings six prebuilt options strategies into one view, making it easier to understand what each strategy is designed to do and explore the research behind it. The group includes three put credit spreads and three call diagonals:
| Strategy | Strategy overview | Option structure |
|---|---|---|
| ETF Put Credit Spread | The goal of this strategy is to take a “not bearish” position while the underlying index or sector is showing strong relative strength. | Put credit spread |
| ETF 2-Days Up Diagonal | The goal of this strategy is to make a bullish speculation once an index or sector has shown two strong consecutive up days. | Call diagonal |
| 200 Day SMA Jumper | The goal of this strategy is to make a bullish speculation when a stock crosses up through its 200-day simple moving average and is also up 3% or more on the day. | Call diagonal |
| RSI Below 30 Call Diagonal | This is a bullish mean-reversion speculation that waits for an oversold stock with 14-day RSI below 30 to start bouncing, then uses a 60-day long 50-delta call against a 30-day short 20-delta call to capture recovery while avoiding earnings. | Call diagonal |
| Credit the Sell-off | Credit the Selloff is a bullish strategy that sells a put credit spread when a stock is deeply oversold (14-day RSI below 25) and flat or down for the day, exiting when 50% of the credit is captured, RSI rises above 40, or earnings are two days away—whichever comes first. | Put credit spread |
| Fade the Dip AI | Fade the Dip AI Short Put Spread is a neutral-to-bullish strategy that sells a put credit spread when a stock reclaims its 200-day SMA while above its 10-day EMA, with 20-day RSI below 70, one-year skew above 0, one-year kurtosis above 1, and option liquidity of at least 4, exiting when 50% of the credit is captured or two days before earnings—whichever comes first. | Put credit spread |
These strategies cover several research scenarios, including strength in an index or sector, a stock reclaiming its 200-day moving average, and oversold conditions. Their objectives range from bullish speculation to neutral-to-bullish positions.
What Active and Near Active actually mean
Active means the strategy’s technical entry conditions are currently met.
Near Active means they are not currently met, but a qualifying price may be within the displayed range, up to $4 above or below the current stock price. The activation display shows where that threshold lies.
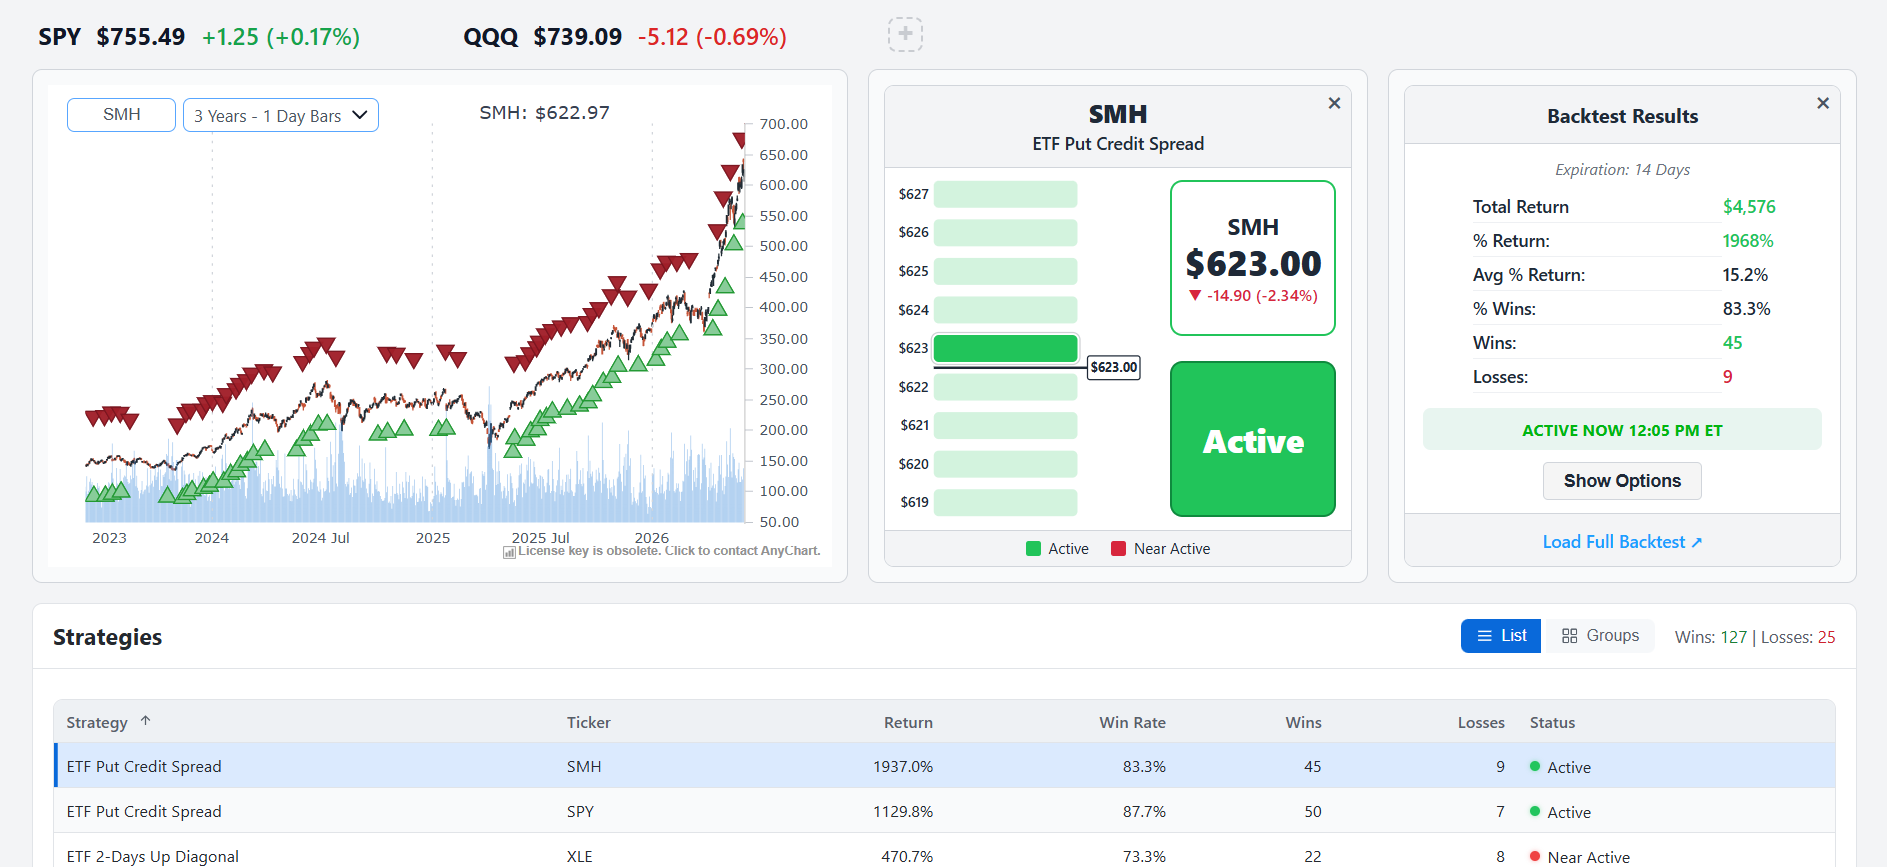
An Active setup connects the historical entry and exit markers, the price activation display, and the backtest results. Show Options is available from this view.
Near Active gives you something to study while you wait. It does not mean the remaining conditions can be skipped, and it does not guarantee that the setup will become Active.
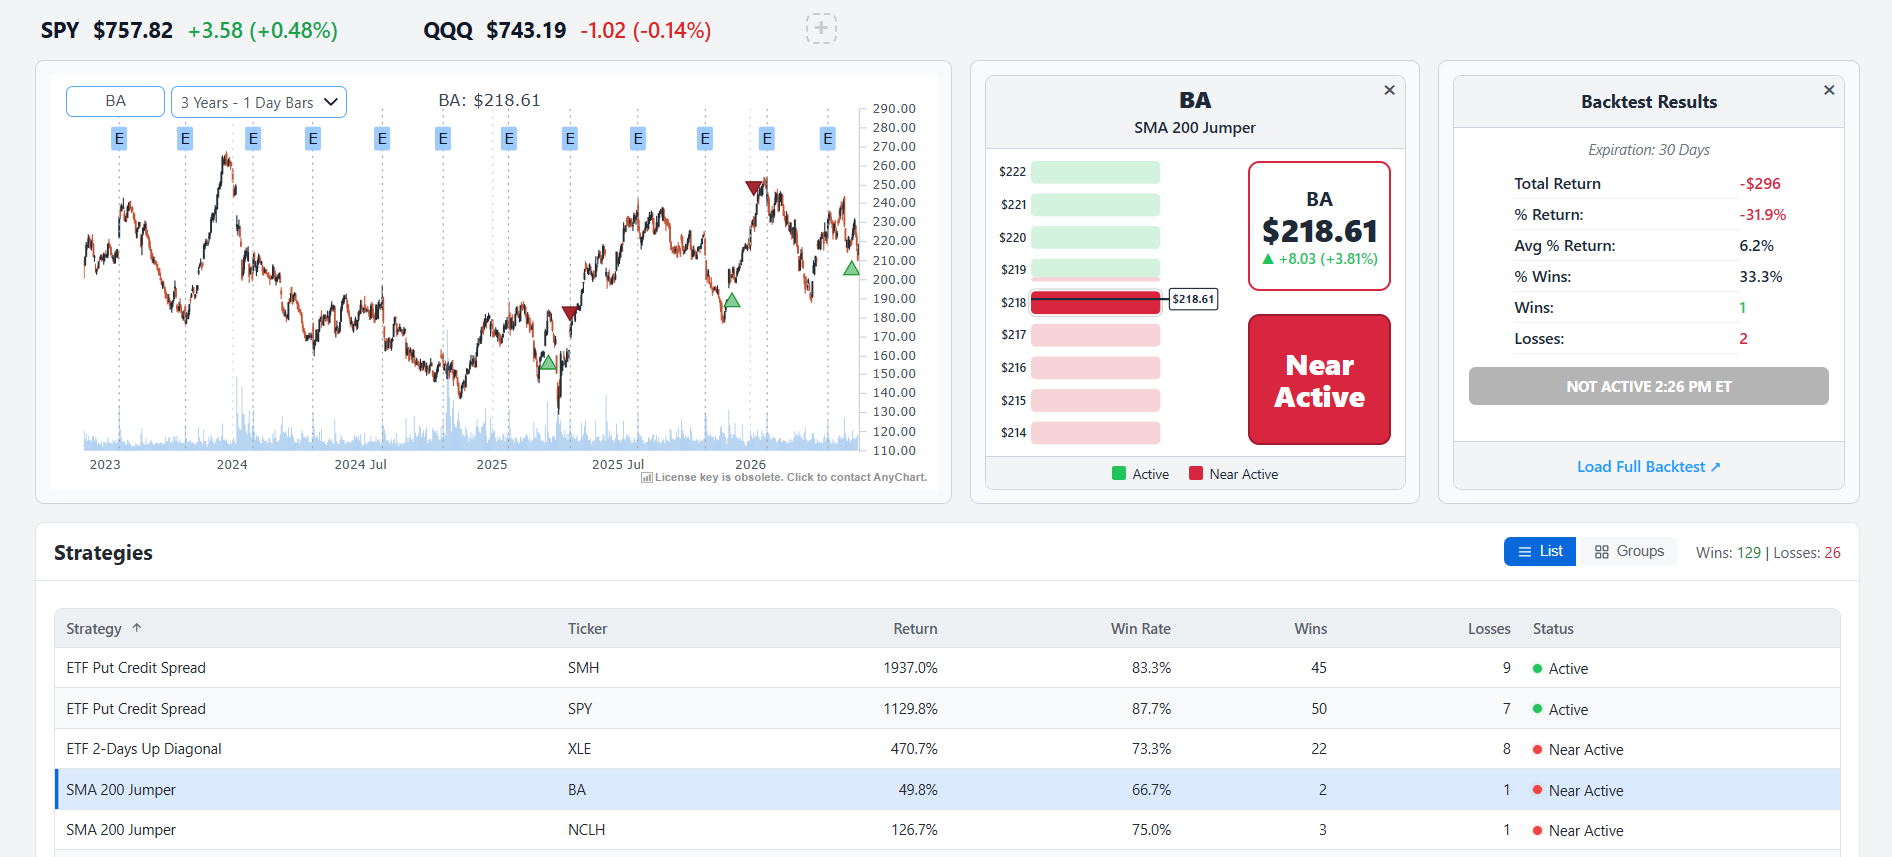
Today 2.0 triggers can arrive in clusters, with several appearing together followed by days without a qualifying setup. Patience is part of the strategy: when the conditions aren’t met, sitting on the sidelines is a deliberate choice.
Today 2.0 makes that selectivity visible. You can see when the research conditions are satisfied and when they are still absent.
Start with a research routine you can repeat
A practical way to explore Today 2.0 is to review the Active and Near Active lists, select a setup, read its entry and exit rules, and inspect the historical trades. When it is active, Show Options connects those rules to specific strikes and expirations for further evaluation.
Explore Today 2.0 inside TradeMachine®
Today 2.0 reduces the work required to find and investigate a qualifying setup. The scan, chart, historical evidence, strategy rules, and option details are connected, so you can spend more time understanding the research.
Existing members can open the Today tab to explore Today 2.0. New members can explore the platform through the webinar offer: $9 for nine days, then $69 per month.
Start your TradeMachine® trial and explore Today 2.0
TradeMachine® is a research, testing, and analysis platform. Capital Market Laboratories® does not provide investment advice, make recommendations, or solicit the purchase or sale of any security. We are not licensed to provide investment advice and would not do so even if licensed. This material is educational. Options involve risk, including loss of capital. Historical backtests are hypothetical, and past performance does not guarantee future results.
Legal
The information contained here is provided for general informational purposes, as a convenience to the readers. The materials are not a substitute for obtaining professional advice from a qualified person, firm or corporation. Consult the appropriate professional advisor for more complete and current information. Capital Market Laboratories (“The Company”) does not engage in rendering any legal or professional services by placing these general informational materials on this website.
The Company specifically disclaims any liability, whether based in contract, tort, strict liability or otherwise, for any direct, indirect, incidental, consequential, or special damages arising out of or in any way connected with access to or use of the site, even if I have been advised of the possibility of such damages, including liability in connection with mistakes or omissions in, or delays in transmission of, information to or from the user, interruptions in telecommunications connections to the site or viruses.
The Company makes no representations or warranties about the accuracy or completeness of the information contained here. Any links provided to other server sites are offered as a matter of convenience and in no way are meant to imply that The Company endorses, sponsors, promotes or is affiliated with the owners of or participants in those sites, or endorse any information contained on those sites, unless expressly stated.