
Lede
There were few surprises in today’s PCE inflation report, with the month over month (MoM) number for PCE coming in slightly below estimates and also slightly below for Core PCE.
The year over year (YoY) numbers were in line with estimates.
- PCE Price Inflation YoY:
- 2.5% vs 2.5% consensus and 2.4% prior.
- PCE Price Inflation MoM:
- 0.33% vs 0.4% consensus and 0.4% prior.
- Core PCE Price Inflation YoY:
- 2.78% vs 2.8% consensus and 2.9% prior.
- Core PCE Price Inflation MoM:
- 0.26% vs 0.3% consensus and 0.5% prior.
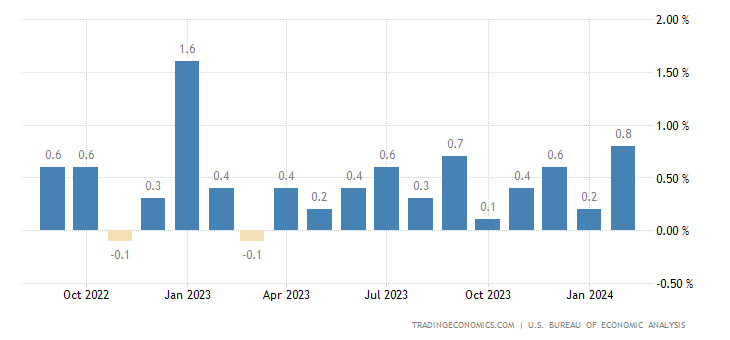
The data surprise came from personal spending which was 0.8% versus 0.5% estimates and 0.2% prior.
This will likely push GDP growth estimates for Q1 (the current quarter) higher when new models come out this weekend and next week.
Preface
Inflation prints in CPI for both Jan and Feb were received by some as normal seasonal perturbations and as a sign that inflation will reignite by others.
The latter point to the core services ex-housing data series that the Fed notes from time to time and it has reaccelerated. Here is a chart:
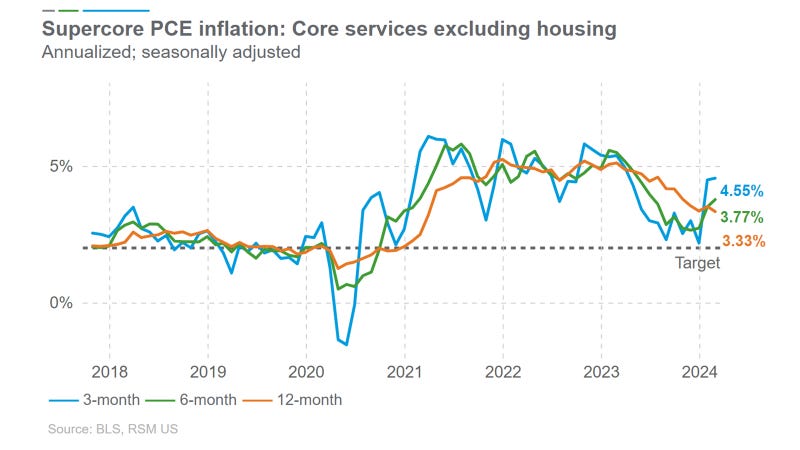
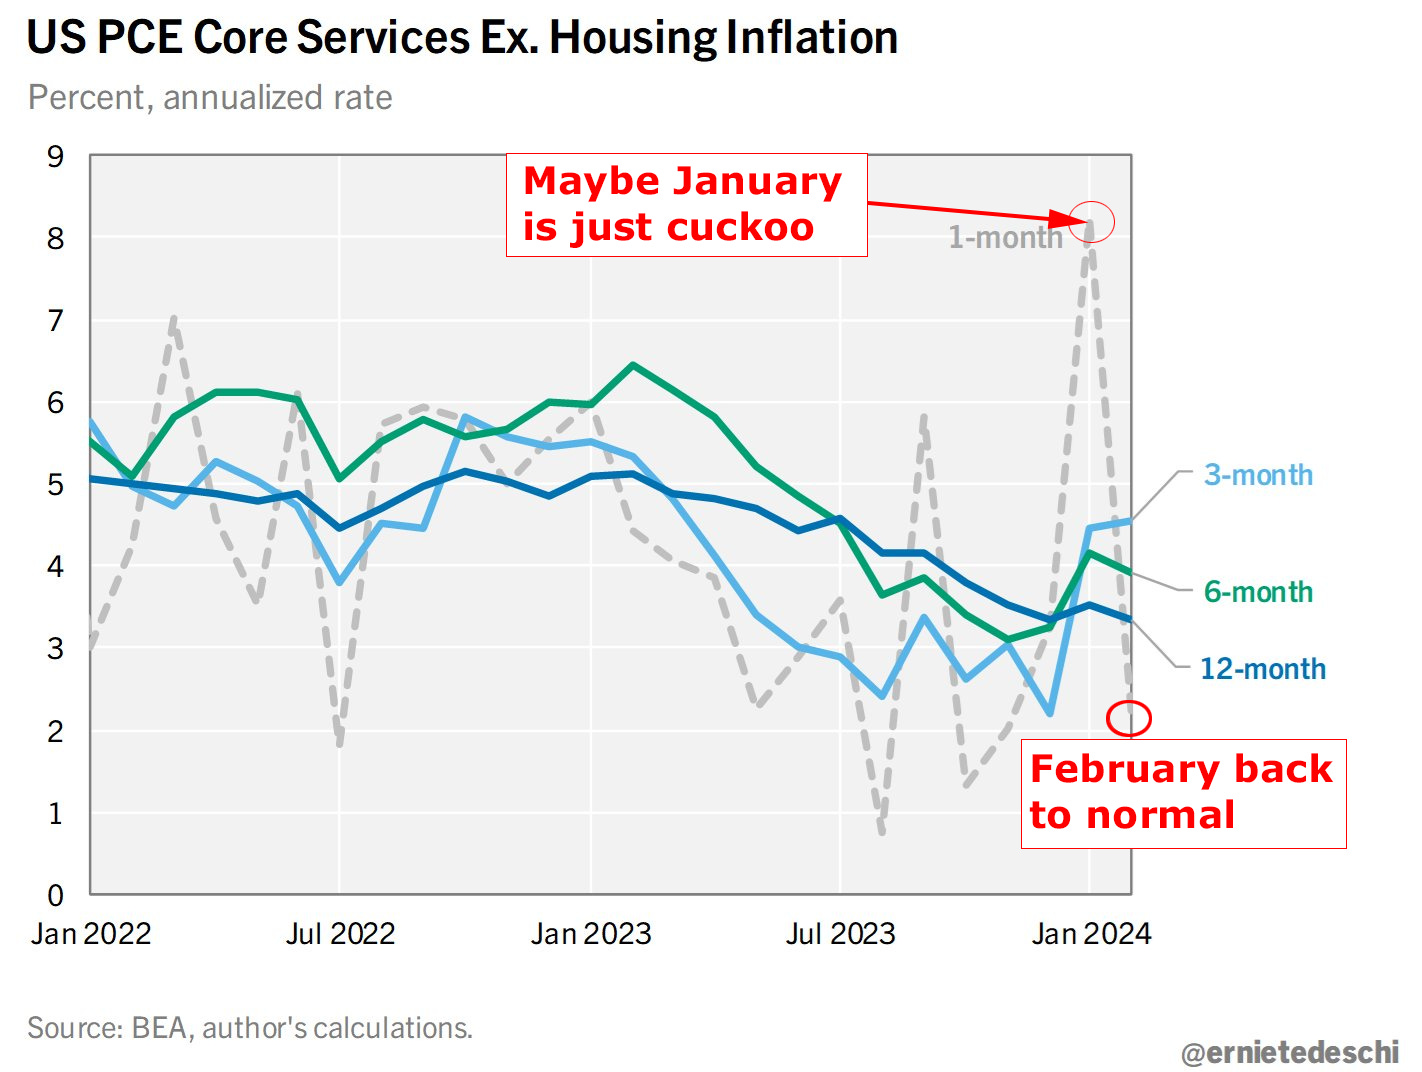
But… core services ex housing inflation normalized in February from its extraordinary January read which is consistent with January being a one-off outlier, though more data is needed.
Here is that same chart but this time with the monthly number drawn in with a dotted line (original chart, before my mark ups, here):
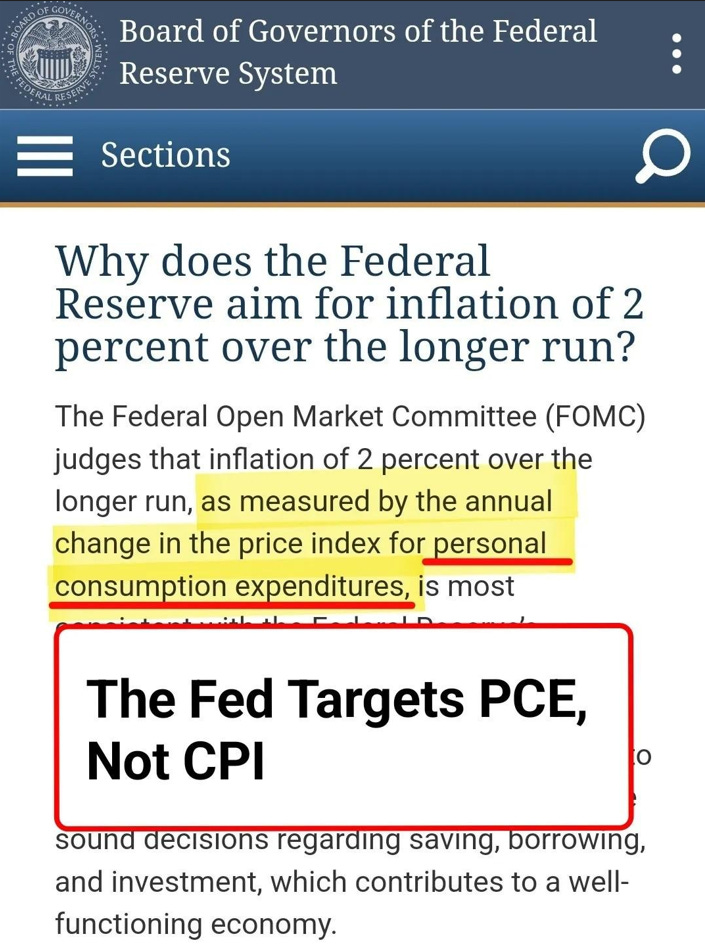
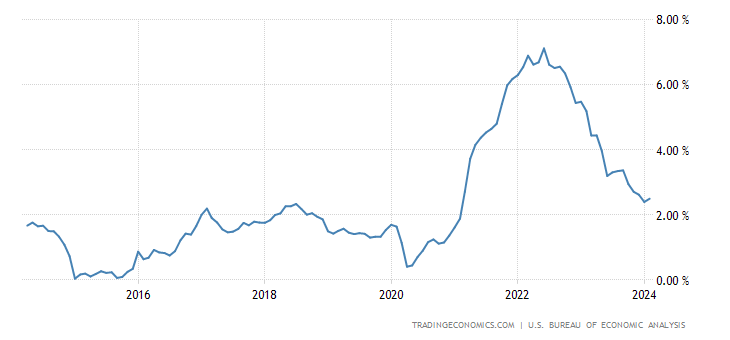
Further, PCE, the Fed’s inflation measure that targets 2% looks relatively stable and at 2.5% is near the target.
Here is a chart:
PCE Price Inflation YoY (Source)
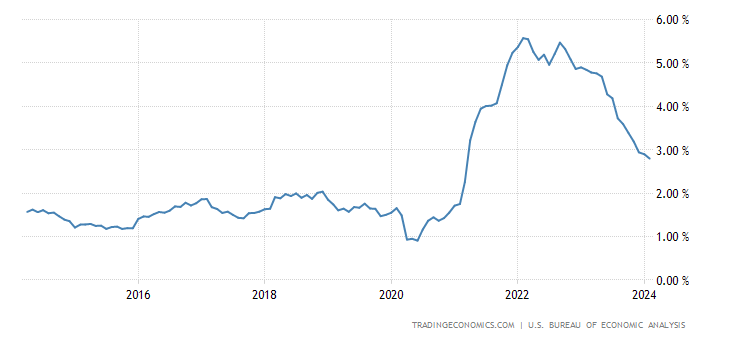
As a proxy for PCE, the Fed notes it looks to Core PCE, which is PCE but excluding food and energy. Here is that chart:
Core PCE Price Inflation YoY (Source)
To some this looks like clear disinflation with the reality that economic data rarely moves in perfect harmony in the short-term.
To others this looks like an inflation problem.
Either way, PCE at 2.5% (or Core PCE at 2.78%) is certainly closer to the Fed’s target than any hyperinflation fears.
The Core PCE YoY number is the lowest in 3-years (after January was revised up).
The unsettled trend in Core PCE YoY can be seen here as we look to various timeframes:
- 1 month: 3.2%
- 3 months: 3.5%
- 6 months: 2.9%
- 12 months: 2.78%
That’s the reverse of a solid disinflationary trend.
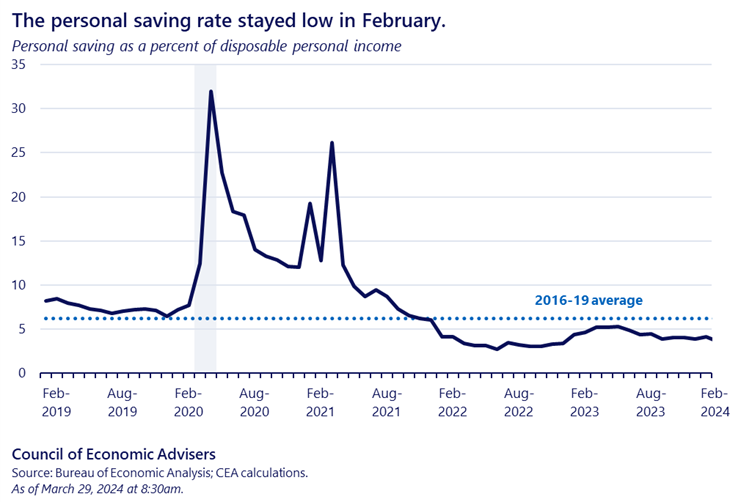
The Council of Economic Advisers (CEA) for the White House commented on the data today, but of a different flavor:
The personal saving rate fell to 3.6% in February. The below-average saving rate may be in-part related to households spending down the assets they accumulated during the pandemic. It may also as reflect recent increases in housing and stock-market wealth.
The CEA shared this chart:
Here is a chart of personal spending, which came in hot and likely means higher Q1 GDP:
US Personal Spending MoM (Source)
Finally, with markets closed today, there is no update to share on treasury yields.
Data
- PCE Price Inflation YoY:
- 2.5% vs 2.5% consensus and 2.4% prior.
- PCE Price Inflation MoM:
- 0.33% vs 0.4% consensus and 0.4% prior.
- Core PCE Price Inflation YoY:
- 2.78% vs 2.8% consensus and 2.9% prior.
- Core PCE Price Inflation MoM:
- 0.26% vs 0.3% consensus and 0.5% prior.
- US Personal Income MoM:
- 0.3% vs 0.4% consensus and 1% prior.
- US Personal Spending MoM:
- 0.8% vs 0.5% consensus and 0.2% prior.
- US Wholesale Inventories MoM:
- 0.5% and -0.2% prior.
Conclusion
What the Fed thinks about inflation is the only thing that matters… as long as the economy stays strong.
Have a fabulous weekend.
Legal
The information contained on this site is provided for general informational purposes, as a convenience to the readers. The materials are not a substitute for obtaining professional advice from a qualified person, firm or corporation. Consult the appropriate professional advisor for more complete and current information. Capital Market Laboratories (“The Company”) does not engage in rendering any legal or professional services by placing these general informational materials on this website.
The Company specifically disclaims any liability, whether based in contract, tort, strict liability or otherwise, for any direct, indirect, incidental, consequential, or special damages arising out of or in any way connected with access to or use of the site, even if I have been advised of the possibility of such damages, including liability in connection with mistakes or omissions in, or delays in transmission of, information to or from the user, interruptions in telecommunications connections to the site or viruses.
The Company makes no representations or warranties about the accuracy or completeness of the information contained on this website. Any links provided to other server sites are offered as a matter of convenience and in no way are meant to imply that The Company endorses, sponsors, promotes or is affiliated with the owners of or participants in those sites, or endorse any information contained on those sites, unless expressly stated.