Lede
What the Fed thinks abut inflation is the only thing that matters.
Today we received the CPI inflation report and it came in a bit hot.
- US Inflation Rate (CPI YoY):
- 3.2% vs 3.1% consensus and 3.1% prior.
- US Inflation Rate (CPI MoM):
- 0.44% vs 0.4% consensus and 0.3% prior.
- Largest since August 2023
- US Core Inflation Rate (Core CPI YoY):
- 3.8% vs 3.7% consensus and 3.9% prior.
- Shelter made up about two-thirds of the YoY increase.
- US Core Inflation Rate (Core CPI MoM):
- 0.36% vs 0.3% consensus and 0.39% prior.
Story
CPI for Feb was in line with expectations but still a high number while Core CPI came in slightly above estimates.
In month/month terms, February CPI+0.44% (largest increase since August 2023); core CPI +0.36% (down slightly from +0.39% in prior month)
On an 3-month annualized basis, CPI core services ex-housing (“supercore”) increased by 6.9% in February
Housing costs remain a key factor pushing inflation higher. Shelter made up about two-thirds of the YoY increase. The lag in US shelter, specifically owners equivalent rent (OER) is now driving the world economy.
Owner’s equivalent rent refers to an estimate of how much homeowners would pay to rent their own homes, used to gauge the value of housing in inflation calculations.
While the increase slowed down from its peak in January , it has not decelerated as much as optimists had anticipated.
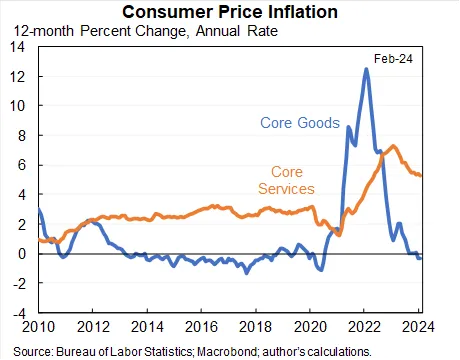
Here is a chart:

Services inflation experienced an increase due to COVID with only a minor reduction. Optimists are hopeful that a continued decrease in housing costs will further lower the services inflation rate.
Here is a chart:

Food prices did not increase (0% YoY), and food at rose home just 1% YoY ago which is constructive and well with pre-pandemic experience.
First, yet again, evidence in chapter and verse that the Fed looks at PCE as its inflation measure (and not CPI); this is from the Fed itself.

If you prefer text, here you go (my emphasis added):
The Federal Open Market Committee (FOMC) judges that inflation of 2 percent over the longer run, as measured by the annual change in the price index for personal consumption expenditures, is most consistent with the Federal Reserve’s mandate for maximum employment and price stability.
The measure of inflation that the Fed follows (PCE) has dropped to 2.4% year over year; essentially at target of 2.0% and continues to drop precipitously.
PCE Inflation

PCE 3-month annualized rate of inflation is 1.8% and the 6-month annualized rate is 2.5%.
Further, the Core PCE, which strips out food and energy from PCE dropped to 2.8% and, too, and continues to drop precipitously.
Core PCE Inflation

Core PCE 3-month annualized rate of inflation is 2.6% and the 6-month annualized rate is 2.5%.
Treasury yields are slightly higher:

The probability of a rate cut has fallen again:

The probability of a cut in May is down to 12% and 67% in June.
Context and Charts – US Inflation Rate (CPI YoY)
– Energy costs decreased less than anticipated (-1.9% vs. -4.6% in January), with gasoline down 3.9% (compared to -6.4%), utility gas service dropping 8.8% (versus -17.8%), and fuel oil decreasing 5.4% (against -14.2%).
– Food prices increased at a slower rate (2.2% vs. 2.6%), along with shelter (5.7% vs. 6%), new vehicles (0.4% vs. 0.7%), and medical care (2.9% vs. 3%).
– Apparel costs remained stable (0% vs. 0.1%), and prices for used cars and trucks continued to fall (-1.8% vs. -3.5%).
– Transportation prices saw a significant increase, rising to 9.9% from 9.5%.
US Inflation Rate (CPI YoY) 10-Year chart (Source)
")
Context and Charts – US Core Inflation Rate (Core CPI YoY)
– The shelter index, making up about two-thirds of the year-over-year increase in the all items excluding food and energy index, rose by 5.7% in February, a slowdown from the 6% increase in the previous month.
– Prices also increased at a slower rate for recreation (+2.1% vs +2.8%) and personal care (+4.2% vs +5.3%).
– However, significant increases continued for motor vehicle insurance (+20.6%, consistent with January) and medical care (+1.4% vs +1.1%).
US Core Inflation Rate (Core CPI YoY) 10-Year chart (Source)
")
Conclusion
What the Fed thinks about inflation is the only thing that matters. So, let’s just wait and let the Fed lead us, for better or worse.
Thanks for reading, friends.
Legal
The information contained on this site is provided for general informational purposes, as a convenience to the readers. The materials are not a substitute for obtaining professional advice from a qualified person, firm or corporation. Consult the appropriate professional advisor for more complete and current information. Capital Market Laboratories (“The Company”) does not engage in rendering any legal or professional services by placing these general informational materials on this website.
The Company specifically disclaims any liability, whether based in contract, tort, strict liability or otherwise, for any direct, indirect, incidental, consequential, or special damages arising out of or in any way connected with access to or use of the site, even if I have been advised of the possibility of such damages, including liability in connection with mistakes or omissions in, or delays in transmission of, information to or from the user, interruptions in telecommunications connections to the site or viruses.
The Company makes no representations or warranties about the accuracy or completeness of the information contained on this website. Any links provided to other server sites are offered as a matter of convenience and in no way are meant to imply that The Company endorses, sponsors, promotes or is affiliated with the owners of or participants in those sites, or endorse any information contained on those sites, unless expressly stated.