Preface
Today we look at bullish chart set-ups that have strength in their tail and skew dynamics and specifically a behavior after earnings.
Charts
We started with the “Directional Charts” screen category and the “Bullish Charts; 3-yr Charts; Nearest Congestion or Trend” screen:

We made sure we looked at stocks with strength in their tail dynamics (we share a video at the end of this post to discuss why this is so crucial to assessing a trade).
We plucked out ticker OVV, in the Energy Minerals sector.
Here is the 3-year chart, with Pattern Finder’s automatic algorithms turned on.
Note the stocks rally off of trend support (the red line) and parabolic move higher off of earnings (7-27-2023).

We can zoom in and see the target zones that are automatically drawn by Pattern Finder more clearly. The next upside target is about 12% higher whereas the next downside target would be 3% lower.

This gives us a bullish chart, with a bounce off of trend support, a positive upside-to-downside target zone (12% to 3%), and excellent kurtosis:

Turning to the option side of the table, first we will set-up a custom earnings backtest:

And we will take a look at the month following an earnings report:

And finally, test simply getting long an out of the money call:

Backtest Link
There you have it: 6 wins out of 11 quarters, with a total return of 1,382%, and an average trade return of 72.6% for that one-month trade.
Alright, let’s turn to the next ticker.
We use the same screen in Pattern Finder, and this time pluck out ticker EXPI.
We turn on all of the algorithms inside Pattern Finder and get the 3-year chart.
Note the huge drop from the COVID mania highs on one-hand, but on the other, a new bullish trend of late:

We can zoom in to see that recent move and not that once the stock broke through the trend resistance line (green line) as drawn by Pattern Finder, that was the signal of a higher move:

The upside to downside target zone comparison (also automatically drawn by Pattern Finder) is 21.4% to 12.4%, so a we get a favorable ratio here as well.
EXPI has earnings due out on 8-3-2023 after the close, so this is a wait and see, but it’s a wait and see with a plan.
The tail dynamics are excellent (we want to see 1-year Kurtosis greater than one or even better, greater than three).

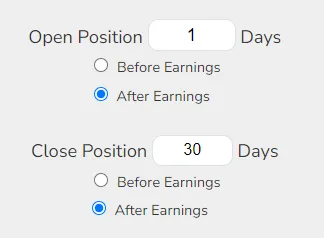
We set the exact same backtest as above – so looking at a backtest that starts one full day after earnings and closes 30 days after that but add one wrinkle…
… We want to backtest the month right after earnings if and only if the stock is down from the earnings results.
We do that by adding a filter at the bottom: checking the box and selecting down 3%, which tells TradeMachine to only open the backtest if and only if the stock was down 3%^ or more off of earnings.

And here are the results over the last three-years:

Backtest Link
So, we have two stock tickers to work with, one (OVV) already has had earnings, has a bullish chart and with good 1-year kurtosis and profit zone to loss zone dynamics, appears to put the probabilities in the favor of a bullish trader.
Going even further, the stock has a history of rising more the month after earnings than it drops, even though the results are about 50/50, the upside for an option backtest has been substantially higher than the downside.
The other stock (EXPI) has an earnings event coming, but a plan surrounding what to do afterwards is in place.
If this seems awfully easy for computing millions of different entry and exit rules, it is. That’s why TradeMachine is the most sought after option backtester in the world.
Alright, have a fabulous week!
Conclusion
There are two videos for you below.
First, a 3-minute snippet which answers the question, “so, what’s so special about TradeMachine?”
3-Minute Snippet: What’s So special About TradeMachine?
Second, the data and rationale behind the remarkable finding we have discovered surrounding our proprietary skew and kurtosis:
Go this page and scroll to the middle for the video.
It looks like this:

Thanks for reading!
Legal
The information contained on this site is provided for general informational purposes, as a convenience to the readers. The materials are not a substitute for obtaining professional advice from a qualified person, firm or corporation. Consult the appropriate professional advisor for more complete and current information. Capital Market Laboratories (“The Company”) does not engage in rendering any legal or professional services by placing these general informational materials on this website.
The Company specifically disclaims any liability, whether based in contract, tort, strict liability or otherwise, for any direct, indirect, incidental, consequential, or special damages arising out of or in any way connected with access to or use of the site, even if I have been advised of the possibility of such damages, including liability in connection with mistakes or omissions in, or delays in transmission of, information to or from the user, interruptions in telecommunications connections to the site or viruses.
The Company makes no representations or warranties about the accuracy or completeness of the information contained on this website. Any links provided to other server sites are offered as a matter of convenience and in no way are meant to imply that The Company endorses, sponsors, promotes or is affiliated with the owners of or participants in those sites, or endorse any information contained on those sites, unless expressly stated.