Preface
Today we look at three more stocks ahead of earnings in an effort to identify prior patterns of bullish moves before the print while avoiding the actual earnings event risk.
Charts and Stocks
We start with a screen in Pattern Finder that has company size filters, return distribution characteristics (skew and kurtosis) filters, and recent upside stock movement.
(If the terms skew and kurtosis are new to you, fear not, we link to an explanatory video in the conclusion.)
Here is the screen from Pattern Finder which limits the entire universe down to just 21 companies.

We start with ticker CSCO, which has a verified next earnings date of 2023‑08‑16 after the market closes.
Here is a snip[pet of the screen data for CSCO:

Now we turn to the 3-year stock chart and enable Pattern Finder’s various algorithms.
We enable these same algorithms on all the stock charts we examine today, so we’ll list them once:
- Trend resistance (green line)
- Trend support (red line)
- Congestion points (pink lines)
- Target zones (red and green shaded areas)
- Patterns
Here is the 3-year CSCO chart. You will notice the uptrend climbing up a rising support line which indicates a series of higher lows:

We then zoom in to see the ratio for upside:downside for the target zones, in this case 5.4 to 3.5; a positive upside:downside set-up:

Everything we have done so far has been inside Pattern Finder:
- Screen
- Chart algorithms
- Charting
- Target zone (upside:downside) analysis.
Next we turn to TradeMachine, which would be a platform for option traders, to take this set-up a step further.
We look at the history of CSCO opening a calendar call spread 14-days prior to earnings and closing it at the latest one-day before earnings (no earnings event risk).

Here is a chart of the phenomenon we are testing, and then a quick description:

We noted with tens of thousands of backtests across multiple market cycles in TradeMachine, including the Great Recession, that about two-weeks before earnings, more often than not, these companies saw their stocks rise.
When we published the research, it was rather well read, as publicly available data from LinkedIn shows the readers:

This is just a snippet from our LinkedIn account from several years ago with readers from Goldman Sachs, BlackRock, Merrill, and many others.
The pattern, simply stated, is a two-week window where certain stocks tend to rise into earnings.
Since the call calendar tested above closes when the short-term options expire, this is in fact a one-week trade backtest.
Here are the backtested results from TradeMachine starting with the 5-year results on the left hand side, then 3-year results, and one-year result, respectively moving left to right.

Backtest link
That looks pretty good if we’re going to lean on probabilities.
The next ticker we plucked was PAYX.
The next earnings date for PAYX is not verified and is likely in the end of September, so this would be one to set an alert for as it is not actionable in the immediate-term.
We start with the 3-year chart and note that PAYX has bounced off of trend support and rocketed higher off of the prior earnings release. Note that the next upside target would be a triple top.

We zoom in for more clarity.
The stock is through the closest congestion line (pink line) and may be headed to a triple top. The upside: downside set-up is 9.2 to 1.6:

All of that analysis came from Pattern Finder.
Next we turned to TradeMachine and ran the same diagonal call spread backtest over 3-years. Here are the results.

But, then we changed the technical open to account for the positive kurtosis. Here is how we changed the technical open with one more filter in TradeMachine:

Now we see that a 67% win rate rose to 75%, and the total return rose from 27.7% to 34.5% on fewer trades.

Backtest link
This is just one example of the remarkable finding we made surrounding skew and kurtosis and shared in our webinar (link to a short summary video in the conclusion of this post.)
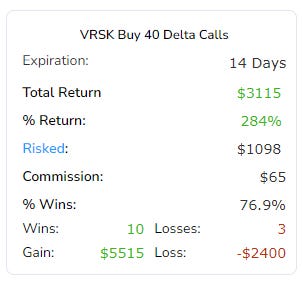
The final stock we looked at is VRSK, also from the same Pattern Finder screen we shared at the top of this note.
VRSK has a verified earnings date of 2023‑08‑02, before market opens.
Here is the 3-year chart. You will notice nicely behaving stock in recent history moving up trend support with a series of higher lows, and then most recently an accelerated move higher:

We zoom in for more context and note that this type of abrupt move higher could indicate more volatility into earnings.

This was all done in Pattern Finder.
Turing to TradeMachine for the option analysis, since earnings for VRSK is less than 14-days from now already, we adjusted our backtest to look at the window 7-days before earnings:

And this time, instead of looking at a diagonal call spread, we backtested a naked long call (closest to 14-days to expiration) and then imposed a 40% stop and 40% limit on the backtest, which if triggered would close the trade before that final day before earnings.
This is what it looks like in TradeMachine.

Alright, and now we share the 5-year backtest of this one-week pre-earnings call from TradeMachine, that always closes before the earnings event.

Backtest link
Those are the three we will look at today. Two of the set-ups have timing that is quite soon, and one is due in a couple of months.
Conclusion
This is an anomaly.
This is a serious finding and it results in superior returns. It results in higher win rates.
It’s so much improved from traditional options trading, that you simply can’t ignore it.
Check out TradeMachine and gain access to the platform and the community of traders surrounding it.
Alternatively, if options aren’t your thing but stocks are, Pattern Finder is your tool and there is a five-minute video discussing these same dynamics but only in stocks. Pattern Finder is woven into the same trading community as TradeMachine.
We are holding a special webinar on “How to Use TradeMachine” (for free) on July 29th, and you can register for that here where we discuss exactly this.
Thanks for reading, and please note the disclaimers below, namely that this is not to be construed as advice, not a solicitation to buy or sell any security ever, and not a replacement for a professional financial advisor.