Preface
We will continue on our path searching for bullish pre-earnings momentum set-ups.
If any of the terms we use in this post are unfamiliar to you, fear not, we have a link to an explanatory video in the conclusion.
Story
Ticker CVS has earnings due out in 14-days and the chart looks a bit bullish and has a backtest that has performed well over the last several years.
We start with the 3-year chart from Pattern Finder and turn on all the chart algorithms:
- Trend Resistance (green line)
- Trend Support (red line)
- Congestion points (pink lines)
- Target zones (green and red shading)
- CANSLIM pattern
CVS has bounced off of trend support at ~$66 and risen now to over $73. Here is a 3-year chart from Pattern Finder:

When we zoom in for clarity, we can see the target zones as drawn automatically by Pattern Finder’s algorithms. There is slightly larger upside per Pattern Finder (+4.8%) than downside (-3.6%) with a rising stock.

That reads as “somewhat bullish” if I were to put it in words and “somewhat bullish” works well for a specific option trade: a calendar call spread.
Here is a chart of the phenomenon and then a quick description:

We noted with tens of thousands of backtests across multiple market cycles in TradeMachine, including the Great Recession, that about two-weeks before earnings, more often than not, these companies saw their stocks rise.
When we published the research, it was rather well read, as publicly available data from LinkedIn shows the readers:

This is just a snippet from our LinkedIn account from several years ago with readers from Goldman Sachs, BlackRock, Merrill, and many others.
The pattern, simply stated, is a two-week window where certain stocks tend to rise into earnings.
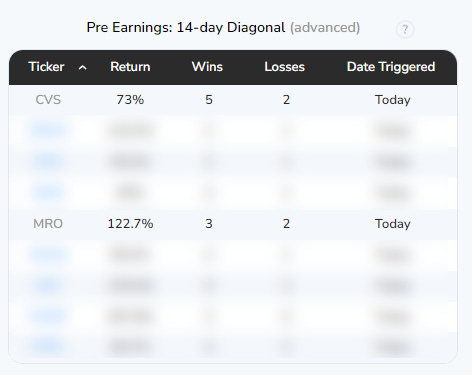
Here are the backtest results for CVS over the last 3-years of that call spread:

We hide the details but TradeMachine members can go to the Today Tab for the full backtest.
This has only triggered once in the last year, and that backtest shoed a 36.7% return over the one week holding period.
The one “not awesome” part of the set-up is that the skew and kurtosis for both six-months and one-year are all negative in the proprietary bucketed algorithm we have developed.
Here is a snapshot from Pattern Finder:

When we do the backtest but layer a requirement that all four of these measures are less than zero, the backtest is still good:

Backtest Link
We see three wins and one loss. My view of this set-up is “decent, but not great.” Of course, that’s personal.
Another trigger today from TradeMachine for this same backtest is ticker MRO. Here is the 3-year chart from Pattern Finder:

When we zoom in we can see that MRO is right on a point of congestion, so Pattern Finder won’t draw in the target zones since it requires some sort of move off of that congestion for the algorithm to attempt a zone.

MRO has seen a pop off of trend support (the red line) and there has been a rise in crude prices recently, so the sentiment could be reasonable. Let’s check that:
We “Ask GPT” in Pattern Finder (or TradeMachine) leveraging our own AI and that of ChatGPT.
Here is the menu item:

This is what we asked:

Here is what we got back:
News Sentiment
I think of sentiment as given from 1 to 100, where 100 is the most bullish. My sentiment is driven by my news reading algorithm and then my volume, relative strength, and stock movement algorithms. I’ll start with news and make adjustments to it if necessary:The sentiment for ticker MRO is neutral 50. The provided headline states that Marathon Oil has scheduled its second-quarter 2023 earnings release and conference call. Since this headline only provides information about a future event without any context or details about the financial results, it should be ignored according to the instructions. Therefore, it does not contribute to the sentiment rating.
Final Sentiment Score Adjustments
– Over the last 30-days, the volume on up days was 1.4x higher than on down days so I have adjusted the sentiment up.– Three month RS (relative strength) is 28 out of 100.
– The final sentiment score I computed was 56 with a 6 point adjustment beyond news.
So, “slightly bullish” in the end. The sentiment isn’t overwhelming one way or the other.
Next, we turn to the skew and kurtosis in Pattern Finder:

In this case, the last six-months have shown strong return distribution characteristics.
The overall backtest for the MRO calendar call spread looks like this:

This is another trade set-up that looks “decent, but not great.”
Finally, we turn to a straight down the middle long call set-up pre-earnings with ticker FROG.
Here is the 3-year chart in Pattern Finder:

The stock has moved through that downward sloping trend resistance (stock is above the green line) and is in a bit of no-man’s land.
We can zoom in for clarity:

This looks like a 50/50 odds of a run into earnings just looking at the chart.
But, we can do more than just look at the chart. Here is the skew and kurtosis:

Alright, now we can look at the backtest, which has this set-up in TradeMachine:

The 40 delta (slightly out of the money) call that is closest to 30-days to expiration is opened 14-days before earnings and closed one day before earnings.
We then require that the one-year skew and kurtosis are greater than zero (which they are right now):

And here are the backtest results over the last 3-years:

Backtest Link
We can check in with the sentiment if we want a further read:

We include the end portion of the results:
Final Sentiment Score Adjustments
– Over the last 30-days, the volume on up days was 1.3x higher than on down days so I have adjusted the sentiment up.– Three month RS (relative strength) is 92 out of 100. A value of 90 or above indicates stronger sentiment, so I have adjusted the sentiment score up.
– The final sentiment score I computed was 61 with a 11 point adjustment beyond news.
Alright, there is slightly positive sentiment and some good skew and kurtosis with a reasonable backtest but a sort of “50/50” chart.
This set-up looks “decent but not great” as well.
Trade analysis is a practice in probabilities and how those probabilities reads are actually subjective in and of themselves, at times.
Some traders wait for “great” set-ups, other lean on decent probabilities and cast a wider net. The decision and responsibility, as always, is on the trader.
Alright, that’s it for today!
Conclusion
To learn about this kurtosis and skew stuff as we discussed it above, or to see more results of our research in option backtests, you can go to this page and scroll to the second video, which looks like this:

On that same page you can learn more about TradeMachine.
Alternatively, if options aren’t your thing but stocks are, Pattern Finder is your tool and there is a five-minute video discussing these same dynamics but only in stocks.
This is about answers, that’s it — empirical and explicit.
Thanks for reading, and please note the disclaimers below, namely that this is not to be construed as advice, not a solicitation to buy or sell any security ever, and not a replacement for a professional financial advisor.
Thanks for reading, friends.
Legal
The information contained on this site is provided for general informational purposes, as a convenience to the readers. The materials are not a substitute for obtaining professional advice from a qualified person, firm or corporation. Consult the appropriate professional advisor for more complete and current information. Capital Market Laboratories (“The Company”) does not engage in rendering any legal or professional services by placing these general informational materials on this website.
The Company specifically disclaims any liability, whether based in contract, tort, strict liability or otherwise, for any direct, indirect, incidental, consequential, or special damages arising out of or in any way connected with access to or use of the site, even if I have been advised of the possibility of such damages, including liability in connection with mistakes or omissions in, or delays in transmission of, information to or from the user, interruptions in telecommunications connections to the site or viruses.
The Company makes no representations or warranties about the accuracy or completeness of the information contained on this website. Any links provided to other server sites are offered as a matter of convenience and in no way are meant to imply that The Company endorses, sponsors, promotes or is affiliated with the owners of or participants in those sites, or endorse any information contained on those sites, unless expressly stated.