Preface
Earnings season will soon be upon us and we will use Pattern Finder and TradeMachine to identify six stocks in a pattern that has, in the past, shown an up trend into earnings.
Screen First
We will start in Pattern Finder and run a screen. Here are the filters:

In English, we are starting with a group of stocks that satisfy the following requirements:
Size filters
- Revenue TTM >= $100M
- MktCap ($M) >= $500M
Distribution Characteristics
- Tail 1yr (1-yr Kurtosis) >= 1
- Tail 6mo (6-mo Kurtosis) >= 1
- Skew 1yr >= 1
- Skew 6mo >= 1
Stock Uptrend
- Stock% 1-wk >= 0%
- Price% 10-days >= 0%
- Stock% 4-wk >= 0%
- Price% 13-wk >= 0%
Sector
- Sector
- Electronic Technology
- Technology Services
So, non-micro cap tech stocks in an up trend with strong return distribution characteristics.
It was easy to miss, but this screen found 53 stocks that satisfy it as of today. Just check out the right hand side which indicates the number of stocks qualifying as each filter is imposed.
We will discuss actual tickers below – several of them…
Alright, that’s our starting point.
Next we turn to the pattern and then backtesting.
Pattern
We noted, several years ago, that a group of stocks exhibited a sort of “optimism” in the stock price before earnings, totally irrespective of the earnings result and even market conditions.
Here is a chart of the phenomenon and then a quick description:

We noted with tens of thousands of backtests across multiple market cycles in TradeMachine, including the Great Recession, that about two-weeks before earnings, more often than not, these companies saw their stocks rise.
When we published the research, it was rather well read, as publicly available data from LinkedIn shows the readers:

This is just a snippet from our LinkedIn account from several years ago with readers from Goldman Sachs, BlackRock, Merrill, and many others.
The pattern, simply stated, is a two-week window where certain stocks tend to rise into earnings.
Now, we turn to backtesting.
Backtesting
We start out in TradeMachine with the custom earnings set-up:

Opening the trade calendar 14-days before earnings and closing at the latest one day prior to earnings.
Then we test a diagonal call spread:

That gets long an at the money call (called “50 delta”) that is closest to 14-days to expiration and sells an out-of-the-money call (“30 delta”) that is closest to 7-days to expiration.
The built in intelligence inside TradeMachine understands that when we start with the custom earnings set-up (first image) and then want to mimic the call spread above, that the longer dated option, the one that is closest to 14-days to expiration will always expire after earnings to minimize the time decay.
That makes this backtest, on average, a one week trade.
Alright, the last thing we do is go into the technical open and let TradeMachine only test these trades if and only if the kurtosis over the last year and six-months as well as the skew over the last year and six-months is greater than 0 (i.e. it’s positive).
It’s basically using drop down menus.

We note that we actually standardize to the normal distribution, so if you’re a statistician, those numbers are actually greater than 3, not 0. (The kurtosis of the normal distribution is 3).
And why do we care about these things?…
The research on pre-earnings optimism (above) was published in 2016, but in our recent research published just this June (2023), we made another discovery, and this one is proprietary.
When we looked at certain return distribution characteristics of stocks for the prior year (and six-months), namely the tail behavior as exhibited in kurtosis, and the return asymmetry as exhibited in skew, we uncovered a remarkable finding.
While we share the finding, we do not share the proprietary algorithm inside our nested forest kurtosis and skew computations; this time we’ll keep algorithm private.
We found many things, which we share in an 8-minute video at the conclusion of this post, but so we don’t bury the lede, it was this:
Stocks that had fatter upside tails per our proprietary algorithm tended to exhibit remarkably better stock returns over the next year.
Not only did we find a 2:1 outperformance, but the win rates, measured as stocks with a positive return over one-year, rose to 66% versus 59% with a statistical significance of 99.83%
So, in short, 2x the return and a higher win rate, over a five-year backtest.
That, in and of itself, is the remarkable finding for stocks, but we then turned back to options and that “pre-earnings optimism” backtest.
Alright, next we took all the tickers we shared above, and dropped them into the backtest we have set-up above.
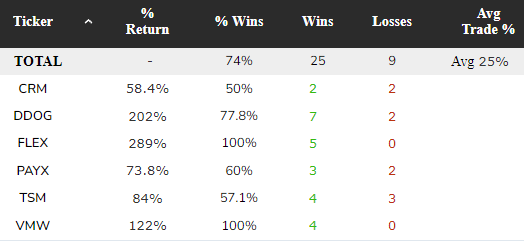
Here are the results for the entire portfolio over the last 3-years.

TradeMachine Backtest Link
That’s a 59% win rate and an average one-week trade return of 17%.
That’s a wow.
And, finally, we will share the best performers of this group. (We don’t share all of the results as that wouldn’t be proper to current paying TradeMachine members.)

Backtest Link
Alright, that’s the post for today: several set-ups to examine as earnings approach and a methodology to use Pattern Finder and TradeMachine together to do this for any group of stocks, not just tech stocks.
Please remember, that each of these stocks would have to be checked 14-days before earnings to make sure they qualify the filters we discussed above.
Conclusion
To learn about this kurtosis and skew stuff as we discussed it above, or to see more results of our research in option backtests, you can go to this page and scroll to the second video, which looks like this:

On that same page you can learn more about TradeMachine.
Alternatively, if options aren’t your thing but stocks are, Pattern Finder is your tool and there is a five-minute video discussing these same dynamics but only in stocks.
This is about answers, that’s it — empirical and explicit.
Thanks for reading, and please note the disclaimers below, namely that this is not to be construed as advice, not a solicitation to buy or sell any security ever, and not a replacement for a professional financial advisor.
Thanks for reading, friends.
Legal
The information contained on this site is provided for general informational purposes, as a convenience to the readers. The materials are not a substitute for obtaining professional advice from a qualified person, firm or corporation. Consult the appropriate professional advisor for more complete and current information. Capital Market Laboratories (“The Company”) does not engage in rendering any legal or professional services by placing these general informational materials on this website.
The Company specifically disclaims any liability, whether based in contract, tort, strict liability or otherwise, for any direct, indirect, incidental, consequential, or special damages arising out of or in any way connected with access to or use of the site, even if I have been advised of the possibility of such damages, including liability in connection with mistakes or omissions in, or delays in transmission of, information to or from the user, interruptions in telecommunications connections to the site or viruses.
The Company makes no representations or warranties about the accuracy or completeness of the information contained on this website. Any links provided to other server sites are offered as a matter of convenience and in no way are meant to imply that The Company endorses, sponsors, promotes or is affiliated with the owners of or participants in those sites, or endorse any information contained on those sites, unless expressly stated.