Preface
Mega cap tech earnings are around the corner and we examine the mega seven, backtesting a specific pattern with two different option strategies both leaning on the return distribution characteristics called ‘kurtosis’ and ‘skew.’
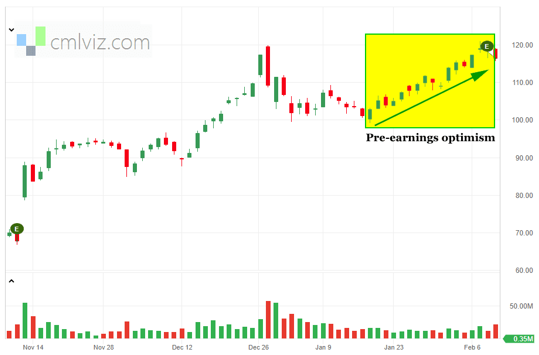
We start with the Pattern.
Pre-earnings Momentum
We noted, several years ago, that a group of stocks exhibited a sort of “optimism” in the stock price before earnings, totally irrespective of the earnings result and even market conditions.
Here is a chart of the phenomenon and then a quick description:

We noted with tens of thousands of backtests across multiple market cycles in TradeMachine, including the Great Recession, that about two-weeks before earnings, more often than not, these companies saw their stocks rise.
When we published the research, it was rather well read, as publicly available data from LinkedIn shows the readers:

This is just a snippet from our LinkedIn account from several years ago with readers from Goldman Sachs, BlackRock, Merrill, and many others.
From this “pre-earnings” optimism pattern we backtested two different option strategies:
- Long Call
- Long a Calendar Call Spread
Neither of these strategies held a position through earnings – these were absolutely and without question not speculations on the earnings results, but rather just that pre-earnings window of optimism.
And then we went further…
The Evolution
The research above was published in 2016, but in our recent research published just this June (2023), we made another discovery, and this one is proprietary.
When we looked at certain return distribution characteristics of stocks for the prior year (and six-months), namely the tail behavior as exhibited in kurtosis, and the return asymmetry as exhibited in skew, we uncovered a remarkable finding.
While we share the finding, we do not share the proprietary algorithm inside our nested forest kurtosis and skew computations; this time we’ll keep algorithm private.
We found many things, which we share in an 8-minute video at the conclusion of this post, but so we don’t bury the lede, it was this:
Stocks that had fatter upside tails per our proprietary algorithm tended to exhibit remarkably better stock returns over the next year.
When we say remarkable, we mean that we tested the constituents of the S&P 500 (starting in 2018) and simply held the stocks with a prior one-year kurtosis greater than 3, a one-year skew greater than 2, and a six-month skew greater than 1 and compared them to the entire index.
The stocks within the S&P 500 that had these three qualifying characteristics had a 20% annual return versus the entire average return of the constituents which had a 10% average return.
Not only did we find a 2:1 outperformance, but the win rates, measured as stocks with a positive return over one-year, rose to 66% versus 59% with a statistical significance of 99.83%
So, in short, 2x the return and a higher win rate, over a five-year backtest.
That, in and of itself, is the remarkable finding for stocks, but we then turned back to options and that “pre-earnings optimism” backtest.
Pre-Earnings Optimism Option Backtests with Kurtosis
For our first iteration of an option strategy to try to benefit from this pre-earnings momentum, we looked at a calendar call spread with the following set-up:

Image source: TradeMachine
That reads as long a 14-day at-the-money call option (50 delta) and short a one-week out-of-the-money call (30 delta), and then closing the entire trade, that’s both legs, after one week.
This is a one-week backtest and takes no earnings speculation.
Here are the results of that strategy before and after we added our proprietary kurtosis:
We can see that the average trade return rose from 10% to 20% in one-week over the three-year backtest while the win rate rose with 97.5% statistical significance once we added a kurtosis filter.
And, to turn this into something more tangible, now we share the 5-year backtest of this call calendar spread 14-days before earnings if and only if the 1-year prior kurtosis (as we measure it) was greater than three, in the seven dominant mega caps:

Image source: TradeMachine ; Backtest link
Overall the win rate has been 59% and the average trade return was 11% for a one week trade, but AAPL, GOOGL, and MSFT did the best.
We then did the same thing but only over the last year:

Image source: TradeMachine
This triggered very few times in the last year given how poorly stocks returned in 2022, but again, AAPL, GOOGL, and MSFT showed strong results.
Well, it’s about two weeks before earnings and as long as you know the kurtosis as we compute it, you have something to consider.
We then did the same thing for a plain vanilla long call 14-days before earnings and closing the call one-day before earnings.
Here is the set-up in TradeMachine:

Image source: TradeMachine
And here are the results for the same mega caps with the same kurtosis requirement over one-year:

Image source: TradeMachine ; Backtest link
As a matter of personal taste, I don’t like naked option buying or selling, but far prefer spreads, like the calendar spread introduced prior, but that’s personal.
So, the question is, how do you find the kurtosis and skew values in real-time, and how do you backtest not just these seven companies but all of them… thousands?
And even further, how do you get alerted to the exact timing you want when the exact set-up is present in the exact stocks you want?
You can do it all in TradeMachine. Yep, one place, all the answers, backtests, data, and alerts.
Legal
The information contained on this site is provided for general informational purposes, as a convenience to the readers. The materials are not a substitute for obtaining professional advice from a qualified person, firm or corporation. Consult the appropriate professional advisor for more complete and current information. Capital Market Laboratories (“The Company”) does not engage in rendering any legal or professional services by placing these general informational materials on this website.
The Company specifically disclaims any liability, whether based in contract, tort, strict liability or otherwise, for any direct, indirect, incidental, consequential, or special damages arising out of or in any way connected with access to or use of the site, even if I have been advised of the possibility of such damages, including liability in connection with mistakes or omissions in, or delays in transmission of, information to or from the user, interruptions in telecommunications connections to the site or viruses.
The Company makes no representations or warranties about the accuracy or completeness of the information contained on this website. Any links provided to other server sites are offered as a matter of convenience and in no way are meant to imply that The Company endorses, sponsors, promotes or is affiliated with the owners of or participants in those sites, or endorse any information contained on those sites, unless expressly stated.